«
Group
Portfolio
Investors
News
Career
Contacts
Group
Portfolio
Investors
News
Career
Contacts
About the group
Profile
Business Model and Strategy
Corporate Governance
Group History
Sustainability
Sustainability Strategy
Products, manufacturing and sourcing
Community and employee commitments
Caring for the environment
The World of Lalique
Art
Crystal Decorative Items
Fragrances
Gastronomy/Hospitality
Interior Design
Jewellery
Perfume Brands
Bentley Fragrances
Brioni Fragrances
Jaguar Fragrances
Lalique Fragrances
Parfums Grès
Parfums Samouraï
Superdry Fragrances
Mikimoto Fragrances
Alain Delon Parfums
Sun Protection
Ultrasun
Fine Spirits and Wine
The Glenturret
The Aberturret
The Château Lafaurie-Peyraguey Wine Estate
Lalique Beauty Services
Corporate Governance
Annual General Meeting
Share Information
Key Figures
Publications
Articles of association
Offer
Working at Lalique Group
Vacancies
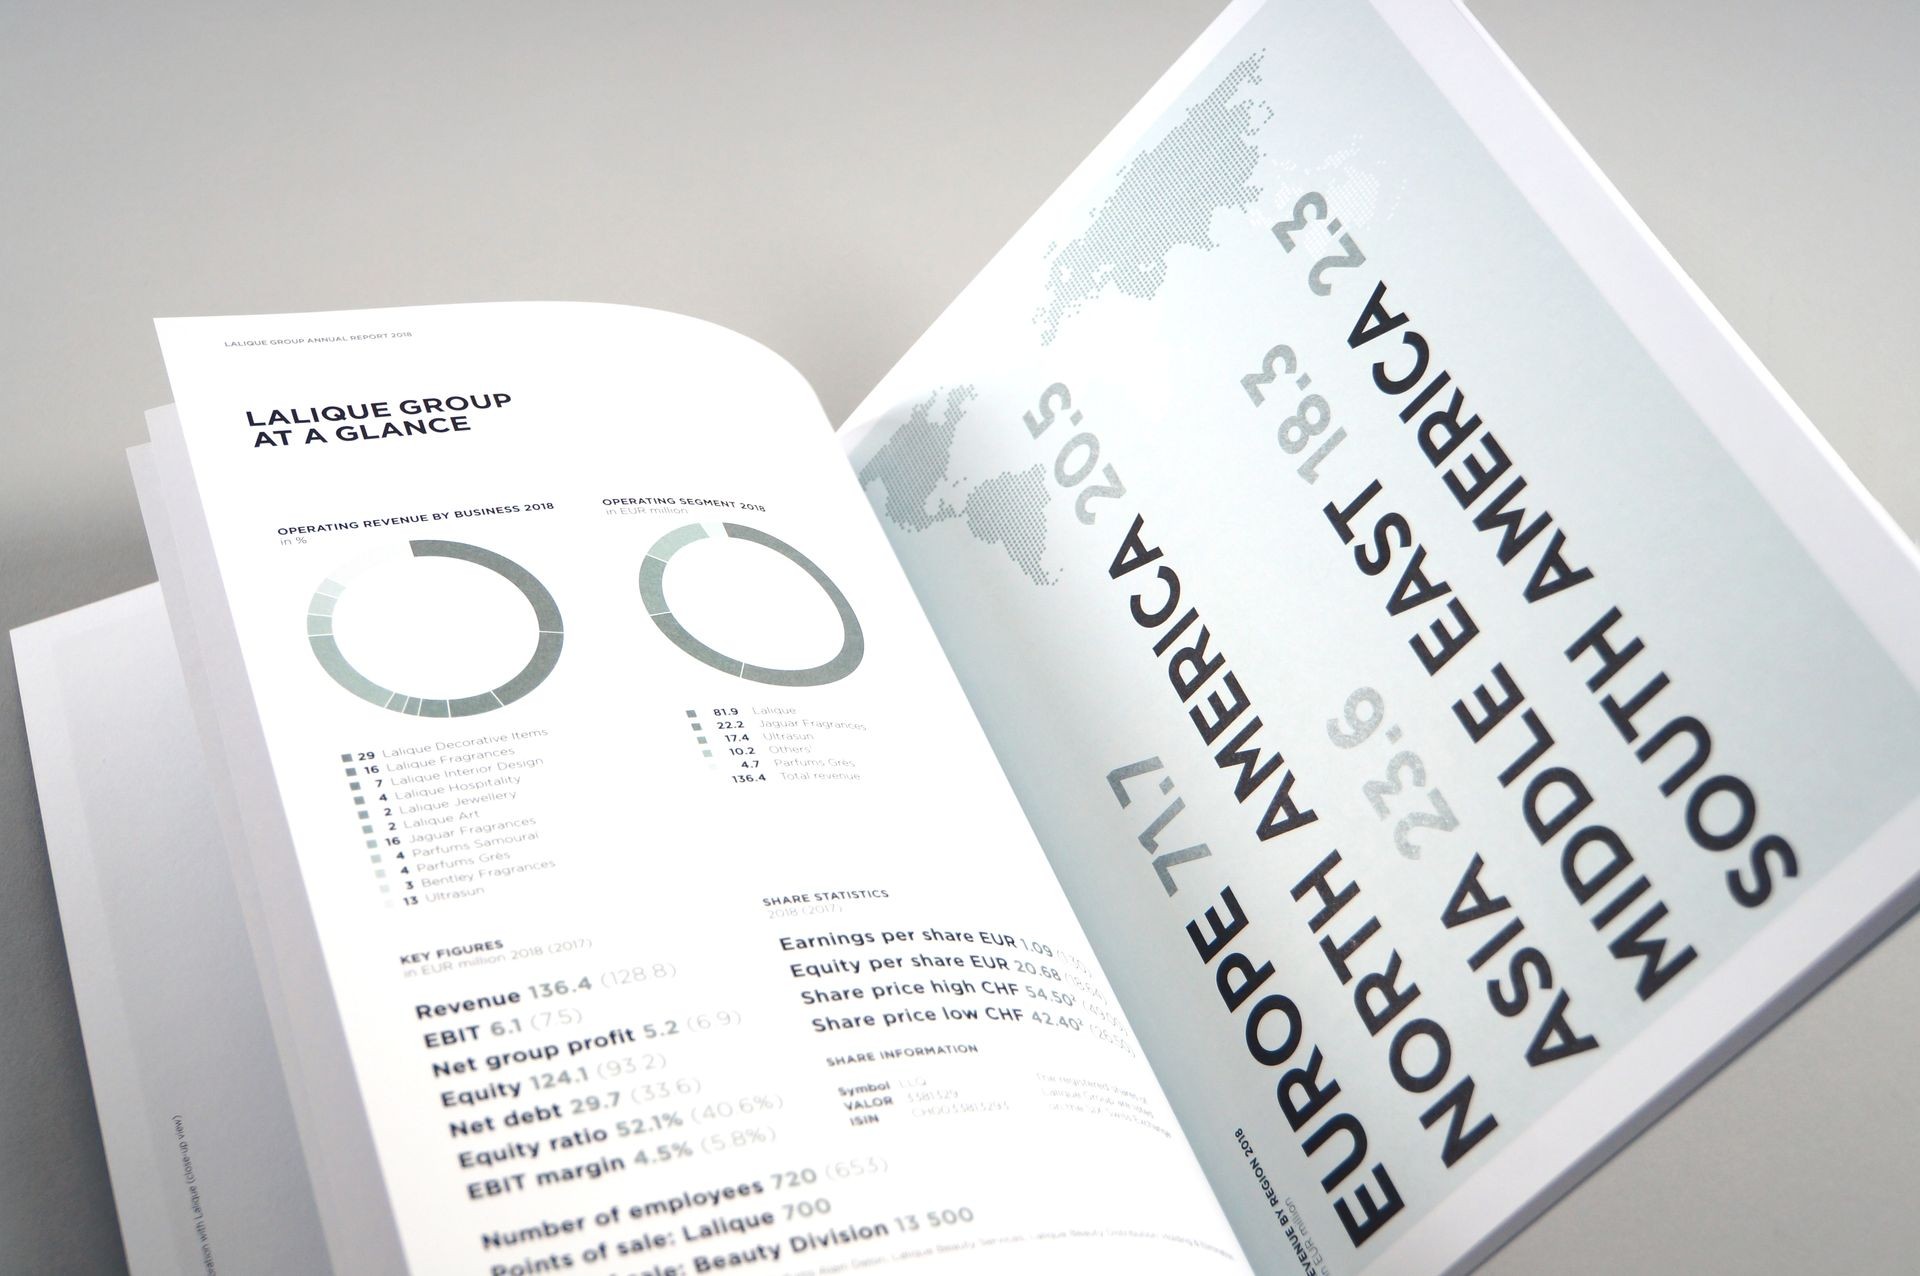
Key Figures
2023/
2022
179.2
170.0
Operating revenue in EUR million
7.0
13.2
EBIT in EUR million
2.4
9.6
Net Group profit in EUR million
216.4
196.7
Equity in EUR million
47.27%
50.08%
Equity ratio
810
766
Number of FTEs
Key Figures 2023
In EUR million
2023
Operating revenue
179.2
Gross result
99.9
Salaries and wages
-46.9
Other operating expenses
-31.5
EBITDA
21.4
Depreciation and amortisation/impairment
-14.4
EBIT
7.0
EBIT margin
3.9%
Financial result
-3.8
Income taxes
-0.9
Net Group profit
2.4
In EUR
2023
Earnings per share
0.34
In EUR million
31.12.2023
Total equity attributable to owners of the parent company
195.8
Equity ratio
47.3%
Key Figures